Insights
In the insights tab of your ML Project, you can explore two major things:
- All your current and past jobs and their terminal output (logging)
- Ad-hoc visualizations to your tabular (CSV) data
Jobs
Jobs will list all active and past jobs of your pipelines. It gives you a good overview about
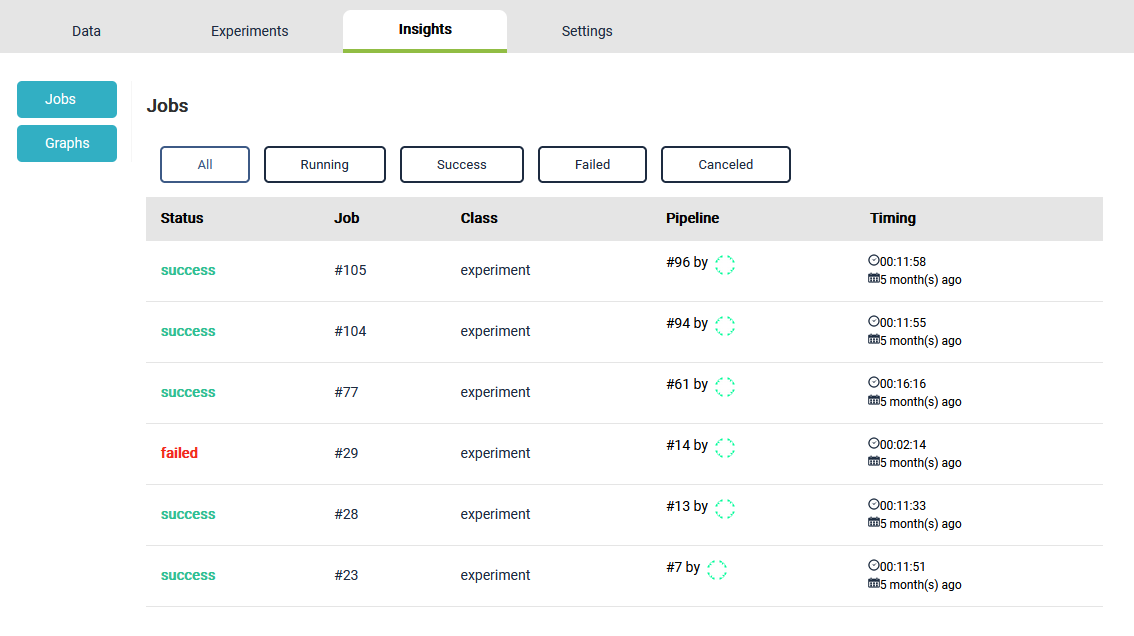
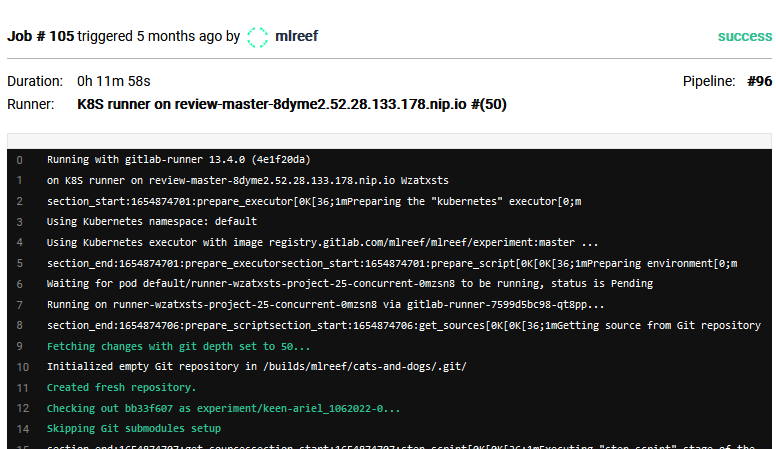
You can access any job to review the log:
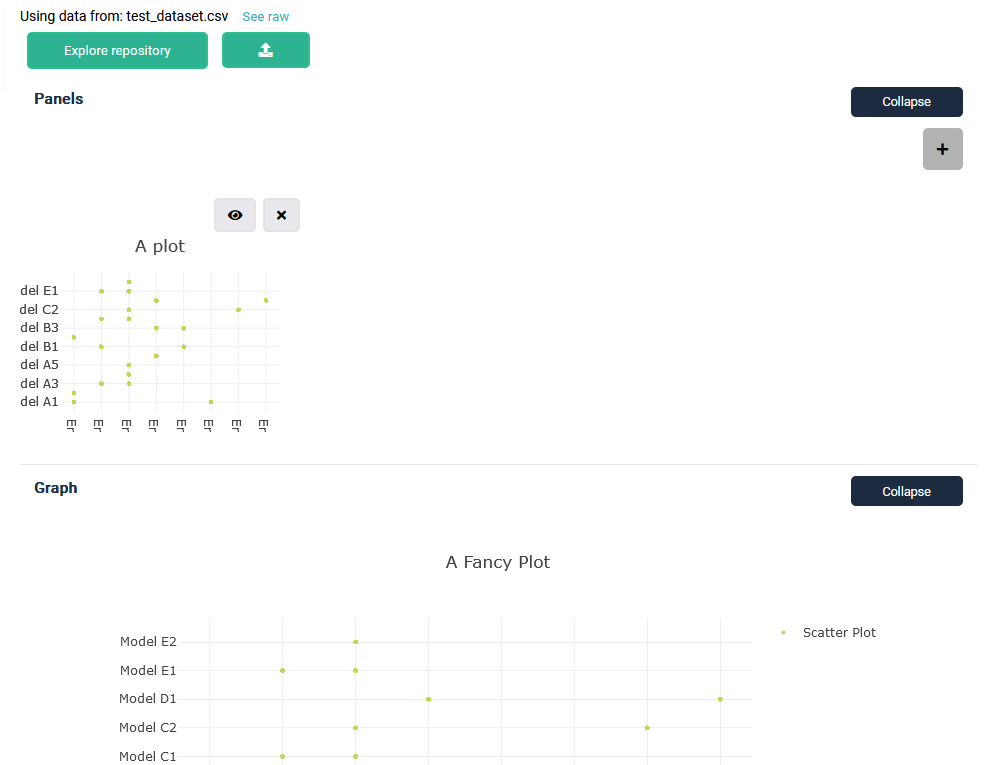
Graphs
The graph tab allows you to create graphs and plots of your CSV files. You either can use a file already existing in your repository or upload a file. It is an easy way to quickly review your data structure using most common visualization techniques, such as plots, line charts or heat maps.
The visualizations are created using the browser. Therefore, large files might take some time to render or even slow your browser significantly!
Create new visualization using the + sign and choose the visualization type of your choice. By pressing the "eye" button, you can maximize the current graph.